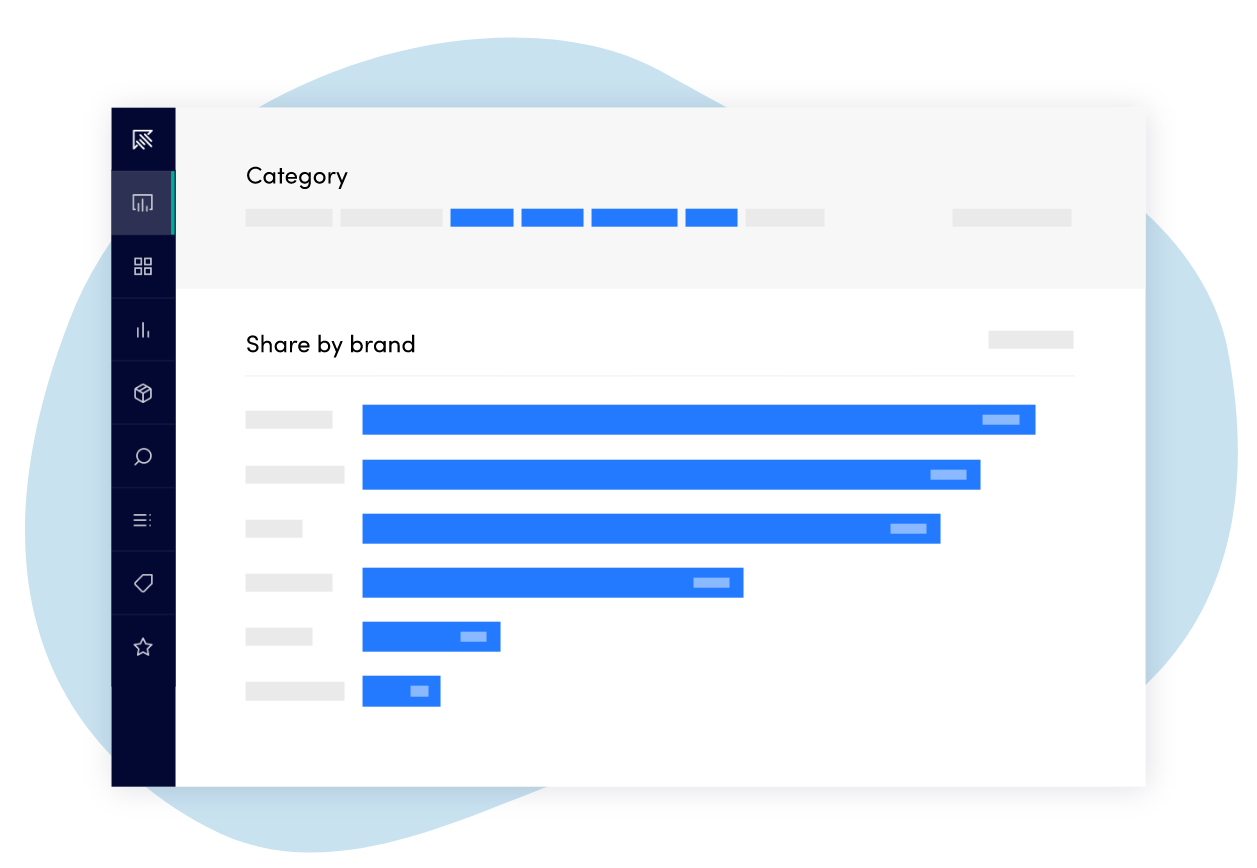
Better algorithms for better intelligence
Fuel your success on Amazon by leveraging actionable data on a global scale


In the dynamic landscape of eCommerce, there is intense brand competition to win on Amazon. Brands are vying for a coveted spot in consumers' minds, where 8 in 10 consumers acknowledge being influenced by digital touchpoints.
In this fiercely competitive landscape, merely having a measurement partner is no longer sufficient. To truly thrive, brands must leverage the most reliable and accurate analytics. Great data emerges from a blend of frequent data collection, historical expertise, and continuously fine-tuned algorithms tailored to navigate the intricacies and complexities of Amazon.
With Profitero’s advanced Sales & Share capabilities and data collected multiple times a day, you can objectively gauge your global eCommerce growth using industry-recognized metrics such as market share. That way you can make smarter decisions to dial investment up or down.
What you can accomplish with
sales & market share data
-
Make smarter, more
strategic bets -
Understand the
digital landscape -
Spot new growth
opportunities -
Remove the guesswork
of growing Amazon sales
- Track category growth rates to see where it makes sense to expand or double down
- Know you’re getting your fair share of category growth so you can develop smarter investment plans
- Isolate the priority products delivering the most sales for your business, so you can support and defend them
- Understand whether your sales, marketing and supply chain investments are moving the needle or not

- Easily compare your Amazon business with your offline brick-and-mortar sales
- Understand what sales are from first-party (1P) versus third-party (3P) sellers on Amazon marketplace
- Estimate the sales of third-party (3P) brands that are beginning to gain momentum
- Align your online market share to match Nielsen, IRI and NPD categories
- Track fast-growing competitors so you can better target who to beat with your advertising
- Size the growth opportunity of new product innovation and development trends
- See which levers, like ad sponsorship, pricing and inventory performance, are having the biggest impact
- Stay two steps ahead of competitors with bespoke, ASIN-level recommendations for improving your Amazon sales
- Ensure you're making the right moves by estimating the ROI of improving various digital shelf levers, like content and search
- Need internal alignment? Quickly grab the 3rd party stats you need to justify investing more with Amazon
/Product%20-%20Measure/ASIN-report.png)
- Track category growth rates to see where it makes sense to expand or double down
- Know you’re getting your fair share of category growth so you can develop smarter investment plans
- Isolate the priority products delivering the most sales for your business, so you can support and defend them
- Understand whether your sales, marketing and supply chain investments are moving the needle or not

- Easily compare your Amazon business with your offline brick-and-mortar sales
- Understand what sales are from first-party (1P) versus third-party (3P) sellers on Amazon marketplace
- Estimate the sales of third-party (3P) brands that are beginning to gain momentum
- Align your online market share to match Nielsen, IRI and NPD categories
- Track fast-growing competitors so you can better target who to beat with your advertising
- Size the growth opportunity of new product innovation and development trends
- See which levers, like ad sponsorship, pricing and inventory performance, are having the biggest impact
- Stay two steps ahead of competitors with bespoke, ASIN-level recommendations for improving your Amazon sales
- Ensure you're making the right moves by estimating the ROI of improving various digital shelf levers, like content and search
- Need internal alignment? Quickly grab the 3rd party stats you need to justify investing more with Amazon
/Product%20-%20Measure/ASIN-report.png)
All-in-one actionable platform:
Estimated sales and share
for Amazon.com
Using sophisticated algorithms and demand signals captured from Amazon, we estimate 1P and 3P competitor sales at the item level with high accuracy and consistency.
Our extensive experience in the industry, coupled with our leadership position, demonstrates the continuous refinement of algorithms necessary to address the intricacies of the Amazon landscape.
Traffic & conversion analytics (Available for Amazon)
Using advanced data science, we deliver accurate estimates of daily traffic, page views and conversion rates for all your Amazon products, with up to two years worth of historical data.
Watch our video to learn more
Our Sales & Market Share data by the numbers
$100B
5B
150
Why Profitero for sales & share data?
Consistent global reporting
Get a comprehensive view of your global Amazon business from one provider
Transparent and validated methodologies
Get the confidence you need to make critical decisions from the data. Our decade plus expertise helps us to refine our algorithm to expertly handle complex challenges, providing you a customized solution tailored to your needs
Quality granular data
Precise data accuracy at both the brand and category levels to effectively gauge market share against competitors. Get the ASIN level data you need for driving action with data scraping that is collected multiple times a day for quality and identifying anomalies
Integrated digital shelf, traffic and conversion analytics
Tie sales and market share data with digital shelf, traffic and conversion analytics in one platform to uncover actions that will continue to drive more growth
Accurate 3P sales estimates
Understand what you're losing to 3P sellers, and which emerging competitors are the biggest threats to your brands
Customized product categories
See your online and offline businesses the same way by creating custom categories or matching Nielsen, IRI and NPD categories
We switched to Profitero for the accuracy of their Amazon Sales & Share data, the easy to use and intuitive interface, and their experience as a trusted partner to accelerate growth.

Nick Swartenbroux
eCommerce Trading Partner,
Nuby


