
One of the best parts about working at Profitero is having access to so much fascinating eCommerce data. But what’s even more rewarding is being able to share it with our customers so they can unlock more growth opportunities and budget.
We see these insights as education tools and conversation starters. I encourage you to share them with your teams, in board meetings, with retailers and beyond to spark new ideas.
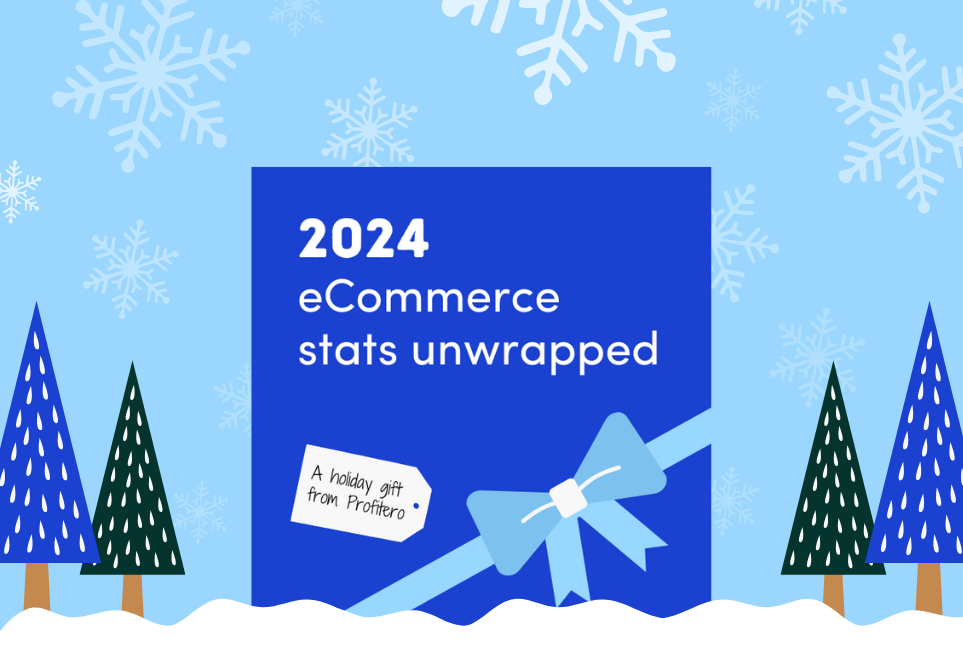
In that spirit, I'm pleased to present Profitero’s holiday gift, eCommerce Stats Unwrapped — a visual recap of our top stats from 2024.
What do these stats reveal about the present and future of eCommerce?
1. They show that leaders are investing in eComm through headcount, strategy and data
In the infographic below, you'll see a few examples from our 8th annual eCommerce Organizational Benchmark Study, showing how leading brands are setting themselves apart from the competition and driving stronger growth. Their investment in eComm isn’t limited to dedicated headcount for eCategory Management: they use data to drive results across their people, partnerships and practices.
- People: Leaders are prioritizing eComm in annual performance KPIs to drive better accountability
and focus.
- Partnerships: Leaders dig into eComm data during the JBP process to set specific goals, budgets and requirements for stronger growth.
- Practices: Leaders invest in advanced analytics and automation to go from a backward-looking, ‘what happened?’ process to a predictive, ‘what next?’ focus.
(If you’re looking to understand more about how leading brands are setting themselves apart, check out our eCommerce Organizational Benchmark Study.)
2. Winning search is harder than ever, but the payoff is still worth it
There are two growing trends that are shrinking the ‘winnable’ space on page 1 of search.
- A well-documented growth in retail media spend that has driven increased competition and higher costs to claim the most valuable spots on the digital shelf. With our latest research finding that 52%* of brands plan to increase their retail media investment in 2025, this trend shows no signs of slowing down.
- Continued downward price pressures have accelerated the popularity of private label brands. Exacerbating this threat, private label products are increasingly dominating online share of page 1. In a number of major categories, brands are struggling for an opening to reach online consumers.
Landing product listings on page 1 might be harder than ever, but it’s worth the effort. Our latest research finds an 89% sales uplift for products that rise from page 2 of search to a top 5 organic spot.
Despite the challenges, winning at search is achievable with the right omni-ready tech-stack. For a deep dive into the size of the prize and practical tips for hitting your search placement targets, check out our latest research - The Impact of Winning Search.
*Source: eCommerce Organizational Benchmark Study.
3. You’re not alone: most brands are looking to level-up their online content strategy
From our conversations with eComm leaders that informed the Defining Content Effectiveness report, we know the first step to reaching content management nirvana is content compliance. Yet, as you’ll see below, maintaining compliance poses a major challenge. Across major eRetailers, 1 in 3 products still have missing or incorrect product content.
And compliance is just the beginning – the real prize is content effectiveness. Product content can serve as a powerful engine for sales growth when it’s optimized for online visibility and shopper conversion. There’s no one-size-fits-all strategy for getting there, but understanding how content benchmarks vary by retailer is essential. Setting the right KPIs for the right channels leads to better-informed and more successful content strategies.
Hopefully, these stats provide you with some ideas for your next big discussion. Stay tuned for even more exciting insights in 2025.
Happy Holidays!
ROI Digital Shelf Methodology
Placement research approach and sample
Using our daily item-level view of Amazon sales, traffic & conversion and search placement data, Profitero studied the impact of more than 22k unique placement performance changes, spanning 3k+ products in multiple categories across Amazon.com & Amazon.co.uk. Data was collected between Jul 1, 2024 and Sep 30, 2024 and excludes Prime Day (July 16-17). This analysis primarily focuses on products moving onto or up page 1 organically. The sales uplift is calculated using the first party unit sales and we control for many external factors including promotions, availability and 1P winning the Buy Box.


