
Since joining Profitero five months ago, I’ve tracked e-commerce performance data for some of the world’s most recognized CPG manufacturers. One thing that never fails to surprise me is the amount of sales lost each month due to products being out-of-stock (OOS) when shoppers go to buy. In other words, the brand itself is doing a terrific job driving interest and traffic to the page, but then fails to convert at the critical final moment because the retailer doesn’t have enough inventory in-stock. In the case of Amazon, this often means some third-party (3P) seller instead is getting credit for the sale.
Sizing the lost opportunity
Here’s an example of what I mean, which demonstrates just how big the opportunity can be.
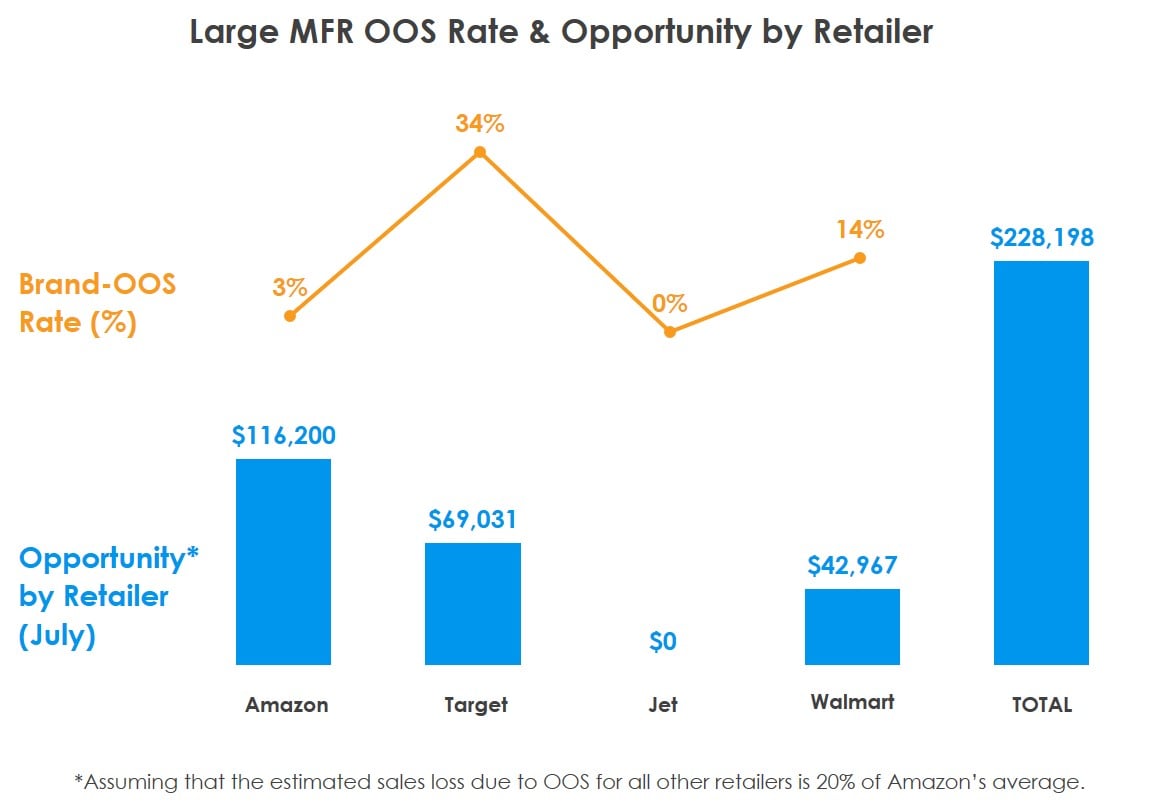
The chart below shows the sales that a large food manufacturer (1000+ SKUs) lost in just one month due to out-of-stocks measured across four major U.S. online retailers. This vendor fundamentally left almost a quarter million dollars in sales ($228,000) on the table in July alone! (Note: Kudos to Jet for its exceptional in-stock levels.)
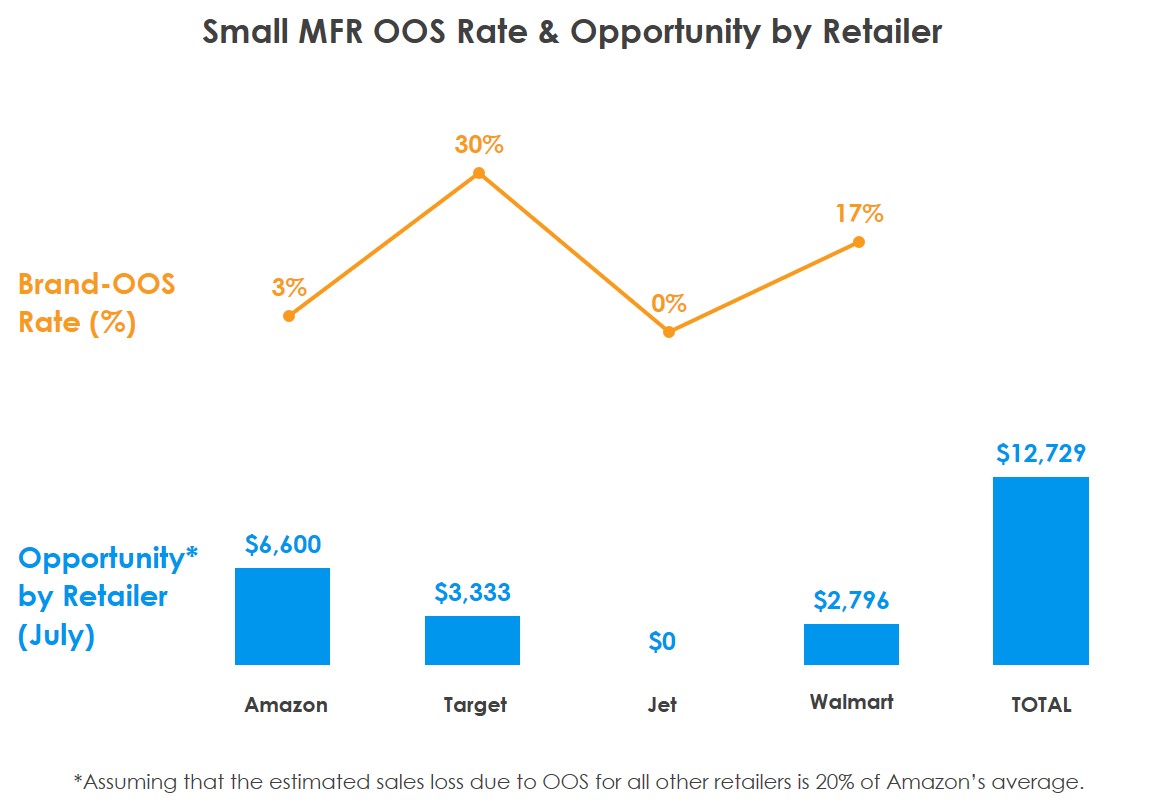
A similar analysis found that a much smaller food manufacturer (100 SKUs) lost nearly $13,000 in sales during the same month due to out-of-stocks across the same four online retailers (see chart below).
Making the case for tracking stock levels
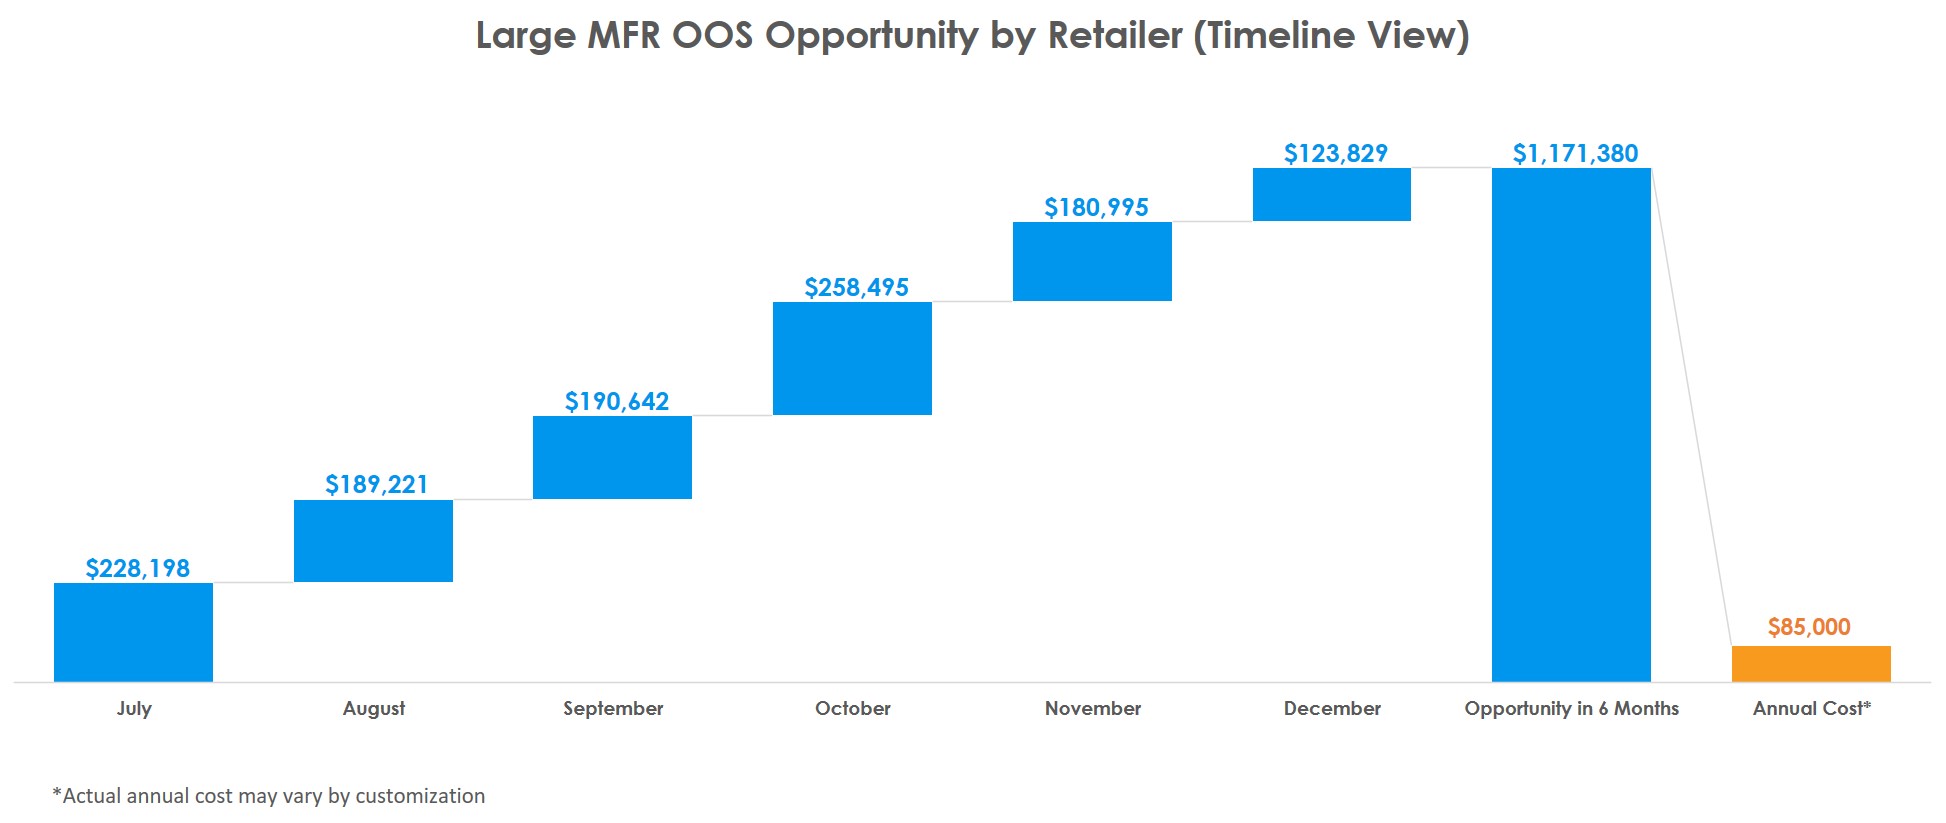
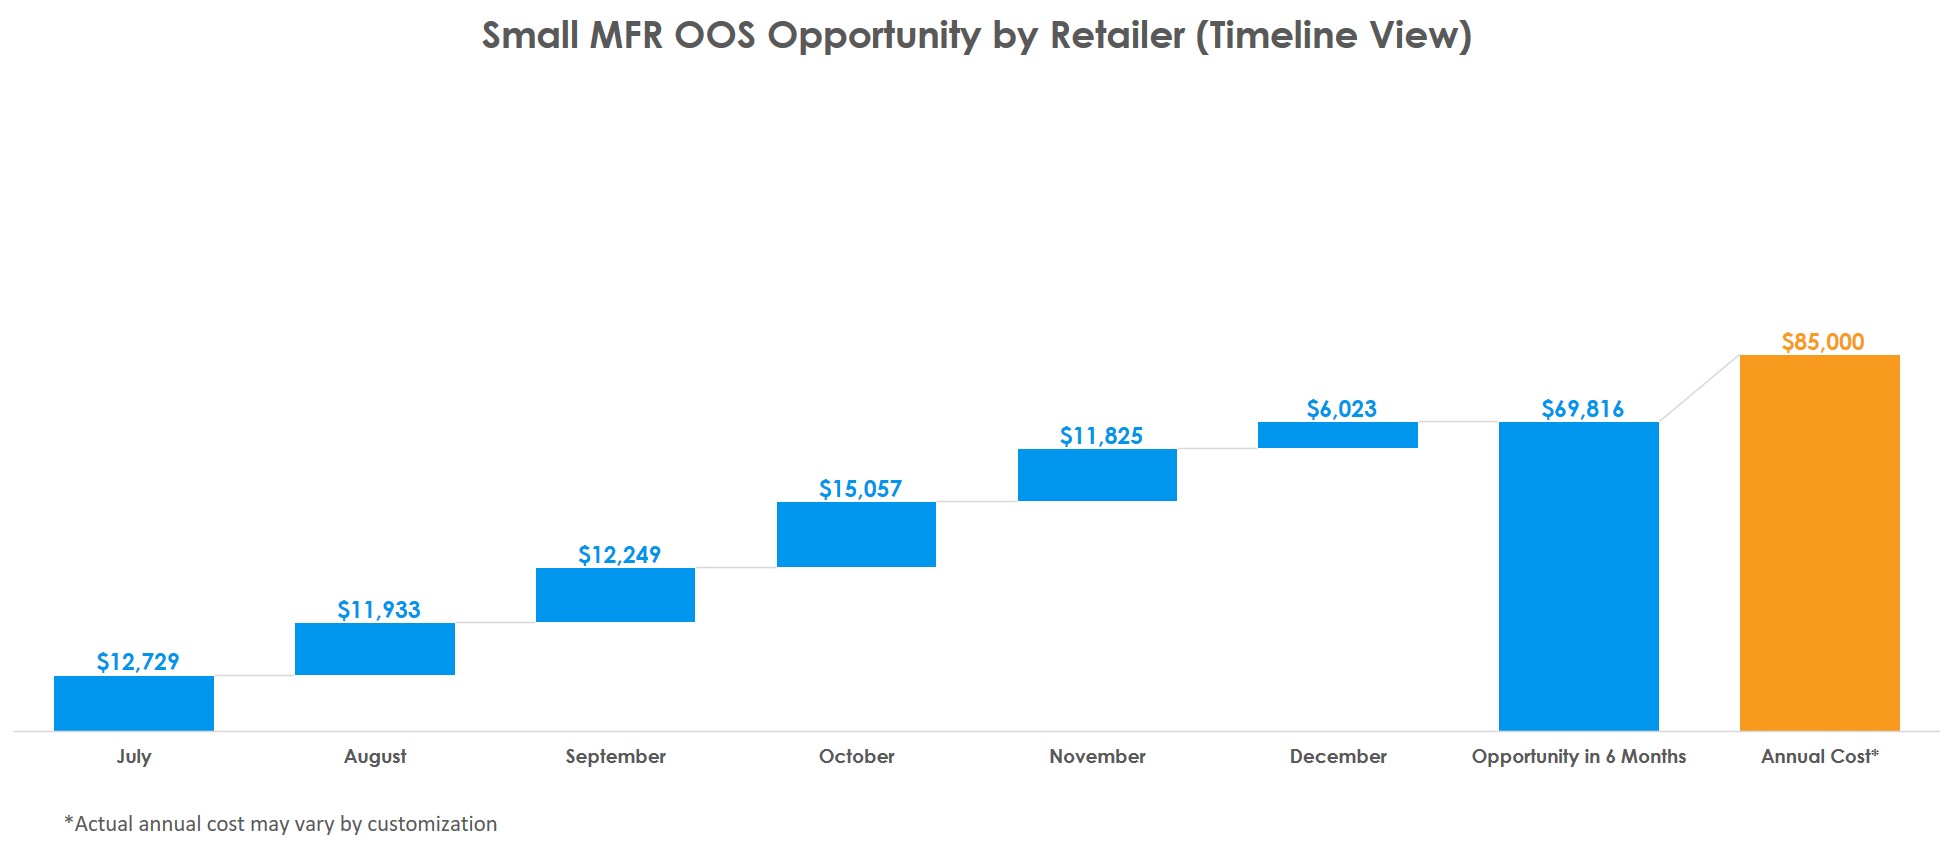
As illustrated by the next two charts, we then tallied up what these same two manufacturers lost over a longer time frame – six months – due to out-of-stocks across the four retailers analyzed. The orange bar (on the right side of the chart) indicates the estimated cost for manufacturers to purchase analytics that could help detect out-of-stock issues, so they could then either increase retailer inventory levels or come up with back-stop fulfillment solutions.
It’s easy to see that the payback in having an analytics solution is almost immediate – for the large manufacturer, it’s just a matter of weeks (assuming most future out-of-stocks can be prevented).
Within a six-month period, the small manufacturer comes very close to covering the cost of analytics JUST by addressing out-of-stock issues. Yes, they have to wait longer than a large manufacturer to see the full ROI (about 7 months versus 2 weeks), but again – this is only about optimizing availability. If the smaller brand also set out to optimize search performance, ratings and content concurrently, chances are strong that they’d more than justify their investment, and probably in a shorter time frame too.
Key takeaway
Many brands are heavily focused on using content and search optimization to drive up online sales – and rightly so. But for companies that want to start simple, a strategy focused on eliminating out-of-stocks may be a solid bet.
Unlike content and search optimization, which often require incremental resources to execute, out-of-stock issues can largely be addressed through better retail communication, smarter inventory management and demand planning, using the people and resources already in place. And OOS can be easily tracked and managed simultaneously across multiple retailers – even when there aren’t extra analyst resources to spare.
The bottom line: Start simple – by identifying and fixing online OOS issues first. Maximizing online product availability is a relatively easy, straightforward and cost-effective way to boost both the top and bottom lines – quickly.
Of course the ROI data above is specific to one category and a few brands, and therefore, highly directional.
If you want to measure the out-of-stock opportunity specific to your brands, reach out and we’ll set you up with analytics, for free.


