Advancing beyond simple communications purposes, mobile devices have become a constant companion with powerful benefits. Among global respondents, 74% say they appreciate the freedom of being connected anywhere, anytime, and 70% strongly or somewhat agree that their mobile device has made their life better. This constant connectivity has not only changed the way we keep in touch, but also the way we shop, bank and pay for goods and services.
The world of commerce is being transformed as consumers use their mobile devices to conduct product research, look for deals or coupons and, increasingly, purchase goods and services from virtually any store from nearly anywhere in the world. Mobile devices are also transforming the banking and payments industry, creating more ways to save and pay than ever before. They’re providing financial inclusion to the estimated 2 billion unbanked consumers around the world.
“Mobile commerce has enormous implications for the entire retail ecosystem,” said Stuart Tagg, Financial Services Leader, Nielsen Europe. “Mobile devices are not only bringing new consumers into the modern, connected economy, but they are also enabling a more customized experience, as products and services can be more closely tailored to behaviors, needs and preferences. But driving higher adoption and usage starts when companies develop a deep understanding of how consumers are shopping and transacting in a digital world and then use that understanding to design strategies around their habits and preferences.”
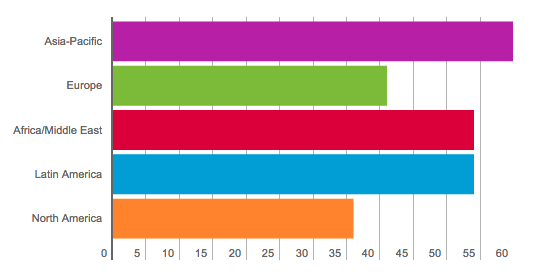
In fact, more than half of global respondents say they use their mobile device when shopping to compare prices (53%) or look up product information (52%). More than four in 10 respondents use their device to look for coupons or deals (44%), make better shopping decisions (42%) or make shopping trips quicker or more efficient (41%).
Asia-Pacific leads the way when it comes to mobile shopping, with use above the global average for every activity included in the survey. In contrast, more than one-quarter of North American (30%) and European (27%) respondents say they don’t use their mobile device for any of those mobile shopping activities.
Consumers use Mobile Devices as a Shopping Sidekick
Percentage who use their mobile device for shopping activities

Base: All respondents who say they own any mobile connected device(s) Source: The Nielsen Mobile Shopping, Banking and Payment Survey, Q1 2016
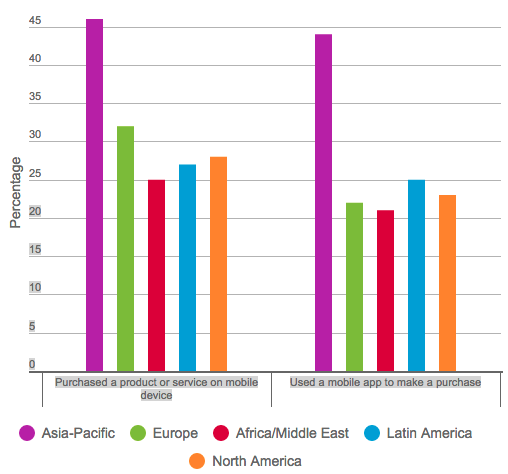
Consumers aren’t just using their devices as a shopping aid. Increasingly, they’re also using them to make purchases. Worldwide, 38% of respondents in Nielsen’s survey say they purchased a product or service on their mobile device in the past six months, and 34% say they used a mobile app to make a purchase in the same period. Asia-Pacific has the highest self-reported rates of mobile purchasing. Half of respondents in China (50%), and roughly half in India (49%), South Korea (47%) and Vietnam (46%) say they purchased a product or service using their mobile device in the past six months. These countries also top the list when it comes to the share of respondents who say they made a purchase via a mobile app (50% in China, 48% in South Korea, 47% in India and 43% in Vietnam).
Asia-Pacific Leads the way with Mobile Shopping
Percentage who say they have performed activity on their mobile device in the past six months

Mobile Shopping Movers & Shakers
| Countries that exceed global average (38%) for purchasing a product or service via mobile device |
Countries that exceed global average (34%) for using a mobile app to make a purchase |
||
| China | 50% | China | 50% |
| India | 49% | South Korea | 48% |
| South Korea | 47% | India | 47% |
| Vietnam | 46% | Vietnam | 43% |
| Russia | 44% | Indonesia | 41% |
| Belarus | 44% | South Africa | 35% |
| Indonesia | 42% | ||
| Romania | 42% | ||
| Ukraine | 41% | ||
| Greece | 40% | ||
| Turkey | 39% |
Base: All respondents who say they own any mobile connected device(s) Source: The Nielsen Mobile Shopping, Banking and Payment Survey, Q1 2016
“Optimizing the mobile experience—whether it’s an app or a mobile version of a desktop site—should be at the heart of any e-commerce strategy,” said Tagg. “A poor mobile experience may lead to lower conversion rates and drive shoppers to competitors’ storefronts, sites or apps. Retailers developing mobile products should keep in mind four fundamental shopper needs: ease, convenience, choice and value. That is, the solution should satisfy a variety of trip purposes and deliver strong value for money in a way that requires less time and effort.”
Other findings include:
- Mobile-banking activities, such as accessing account information (47%) and paying bills (42%), are more common than transferring money between bank accounts (36%). Usage rates are highest in Asia-Pacific.
- Millennials are more than twice as likely as Baby Boomers and Silent Generation respondents to say they’re likely to use a mobile-only bank.
- Mobile-only banking is most popular in developing countries with large unbanked populations; usage rates are highest in India (46%), Indonesia (37%), Mexico (34%) and Turkey (34%).
- Security concerns top the list of mobile-banking barriers (53% of global respondents), followed by a preference for physical locations (31%) and not needing the service (28%).
- Facial recognition software (41%) and check scanning/deposit technology (39%) are the most commonly cited features that mobile device owners want to see in future banking apps.
- More than one-third of global respondents say they’re highly likely to transfer money to (36%) and/or receive money from (34%) another person using their mobile device in the next six months.
For more detail and insight, download Nielsen’s Global Mobile Shopping, Banking and Payment Report. You might also be interested in listing to Profitero’s recent podcast: The Importance of Mobile Ready Hero Images.
About The Nielsen Global Survey
The Nielsen Mobile Shopping, Banking and Payment Survey was conducted March 1–23, 2016, and polled online consumers in 63 countries. The survey polled more than 30,000 respondents throughout Asia-Pacific, Europe, Latin America, the Middle East/Africa and North America. The sample for the survey includes internet users who agreed to participate in this survey and has quotas based on age and sex for each country. It is weighted to be representative of internet consumers by country. Because the sample is based on those who agreed to participate, no estimates of theoretical sampling error can be calculated. However, a probability sample of equivalent size would have a margin of error of ±0.6% at the global level. This Nielsen survey is based only on the behavior of respondents with online access. Internet penetration rates vary by country. Nielsen uses a minimum reporting standard of 60% internet penetration or an online population of 10 million for survey inclusion.


